In order to more fully understand the spectral response of a DSLR camera, we decided to analyze to selected CCD and CMOS cameras. Using a monochromator, we took a series of pictures of wavelengths from 375nm to 1000nm. The particular polychromatic light used as the input for the monochromator had little energy below 375nm, so we did not attempt to measure UV response for this test. We split the monochomatic light output between two fiber optics cables. One was routed to our spectrometer and the other was routed to the camera. The camera had no lens for this experiment.
We took a series of pictures and noted both the wavelength and relative power on the spectrometer. Because the light source has its own spectral curve and the grating in the monochomator has its particular efficiency curve, we have to adjust the raw picture data. Since we are able to read the same monochromator output signal as the camera using the spectrometer which measures both frequency and output power, we are able to create an adjustment table.
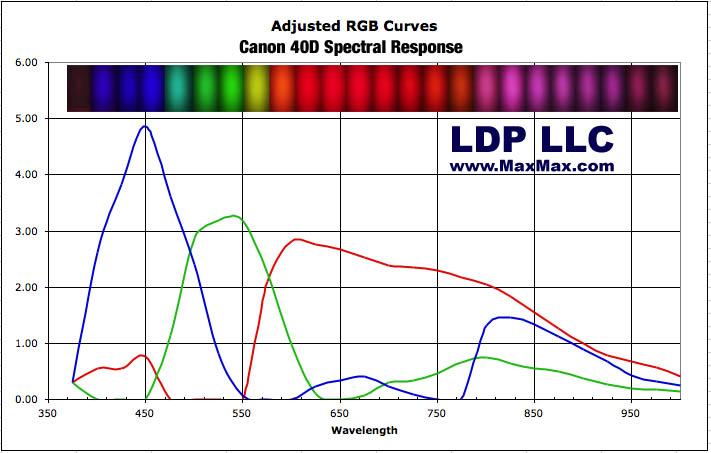
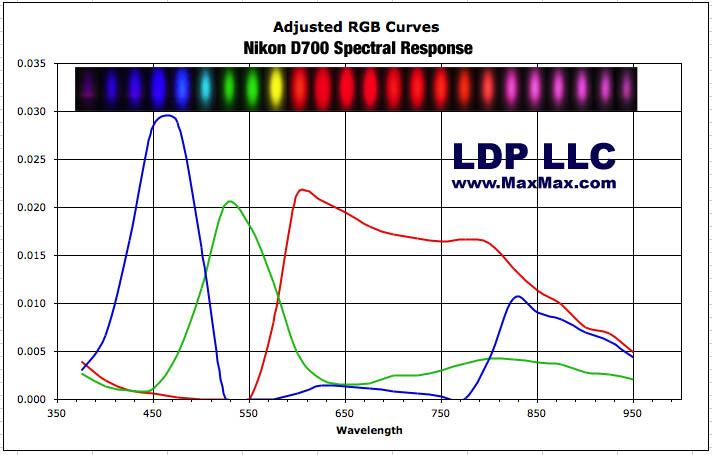
Each picture was opened in Photoshop and the RGB raw values were compiled. Using our adjustment table, we adjusted the raw RGB values to create the adjusted spectral response curve shown below. The black bar at the top with the colored ovals are a compilation of the pictures taken and will give you an idea of the expected result when taking a picture of a particular wavelength.
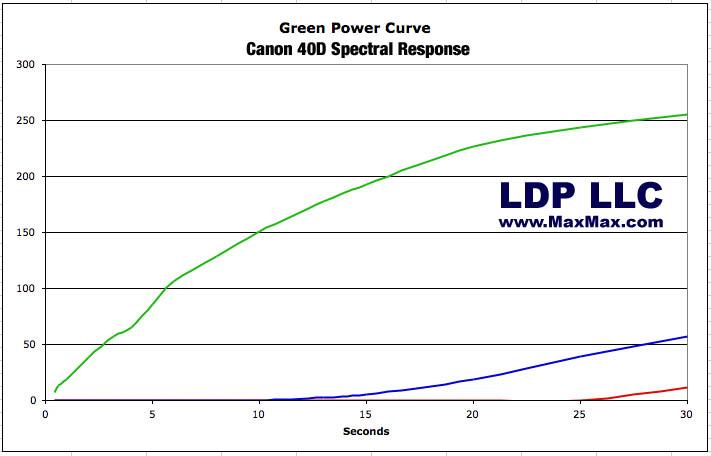
We measured the linearity of the sensor response the RGB peaks of 450nm, 550nm and 625nm. To measure linearity, we set the monochromator at the measurement frequency and varied the shutter speed from 1 to 30 seconds. The raw linearity graphs show that the sensor response is not completely linear. Ideally, the camera's response at a set frequency should be linear with time.
Canon 40D Green Linearity. Notice also how the Blue and Red channels have some leakage. This is because the Color Filter Array (CFA) or Mosaic filter is not perfect. Some unwanted green light leaks past the blue and red filters.