NDVI History
You can jump to the Remote Sensing Section of our online store by clicking here.
The Normalized Difference Vegetation Index (NDVI) is a simple numerical indicator that can be used to analyze remote sensing measurements, typically but not necessarily from a space platform, and assess whether the target being observed contains live green vegetation or not.
Brief history
The exploration of outer space started in earnest with the launch of Sputnik 1 by the Soviet Union on 4 October 1957. This was the first man-made satellite orbiting the Earth. Subsequent successful launches, both in the Soviet Union (e.g., the Sputnik and Cosmos programs), and in the U.S. (e.g., the Explorer program), quickly led to the design and operation of dedicated meteorological satellites. These are orbiting platforms embarking instruments specially designed to observe the Earth's atmosphere and surface with a view to improve weather forecasting. Starting in 1960, the TIROS series of satellites embarked television cameras and radiometers. This was later (from 1964 onwards) followed by the Nimbus satellites and the family of Advanced Very High Resolution Radiometer instruments on-board the National Oceanic and Atmospheric Administration (NOAA) platforms. The latter measure the reflectance of the planet in red and near-infrared bands, as well as in the thermal infrared. In parallel, NASA developed the Earth Resources Technology Satellite (ERTS), which became the precursor to the Landsat program. These early sensors had minimal spectral resolution, but tended to include bands in the red and near-infrared, which are useful to distinguish vegetation and clouds, amongst other targets.
With the launch of the first ERTS satellite – which was soon to be renamed Landsat 1 – on July 23, 1972 with its MultiSpectral Scanner (MSS) NASA funded a number of investigations to determine its capabilities for Earth remote sensing. One of those early studies was directed toward examining the spring vegetation green-up and subsequent summer and fall dry-down (the so-called “vernal advancement and retrogradation”) throughout the north to south expanse of the Great Plains region of the central U.S. This region covered a wide range of latitudes from the southern tip of Texas to the U.S.-Canadian border, which resulted in a wide range of solar zenith angles at the time of the satellite observations.
The researchers for this Great Plains study (PhD student Donald Deering and his advisor Dr. Robert Haas) found that their ability to correlate, or quantify, the biophysical characteristics of the rangeland vegetation of this region from the satellite spectral signals was confounded by these differences in solar zenith angle across this strong latitudinal gradient. With the assistance of a resident mathematician (Dr. John Schell), they studied solutions to this dilemma and subsequently developed the ratio of the difference of the red and infrared radiances over their sum as a means to adjust for or “normalize” the effects of the solar zenith angle. Originally, they called this ratio the “Vegetation Index” (and another variant, the square-root transformation of the difference-sum ratio, the “Transformed Vegetation Index”); but as several other remote sensing researchers were identifying the simple red/infrared ratio and other spectral ratios as the “vegetation index,” they eventually began to identify the difference/sum ratio formulation as the Normalized Difference Vegetation Index. The earliest formal reporting of the NDVI was in 1973 by Rouse et al. (Dr. John Rouse was the Director of the Remote Sensing Center of Texas A&M University where the Great Plains study was conducted). The person responsible for a series of early scientific journal articles describing uses of the NDVI was Compton Tucker of NASA's Goddard Space Flight Center.
Thus, NDVI was one of the most successful of many attempts to simply and quickly identify vegetated areas and their "condition," and it remains the most well-known and used index to detect live green plant canopies in multispectral remote sensing data. Once the feasibility to detect vegetation had been demonstrated, users tended to also use the NDVI to quantify the photosynthetic capacity of plant canopies. This, however, can be a rather more complex undertaking if not done properly, as is discussed below.
Rationale
Live green plants absorb solar radiation in the photosynthetically active radiation (PAR) spectral region, which they use as a source of energy in the process of photosynthesis. Leaf cells have also evolved to scatter (i.e., reflect and transmit) solar radiation in the near-infrared spectral region (which carries approximately half of the total incoming solar energy), because the energy level per photon in that domain (wavelengths longer than about 700 nanometers) is not sufficient to be useful to synthesize organic molecules. A strong absorption at these wavelengths would only result in over-heating the plant and possibly damaging the tissues. Hence, live green plants appear relatively dark in the PAR and relatively bright in the near-infrared By contrast, clouds and snow tend to be rather bright in the red (as well as other visible wavelengths) and quite dark in the near-infrared.
Since early instruments of Earth Observation, such as NASA's ERTS and NOAA's AVHRR, acquired data in the red and near-infrared, it was natural to exploit the strong differences in plant reflectance to determine their spatial distribution in these satellite images. The NDVI is calculated from these individual measurements as follows:
where RED and NIR stand for the spectral reflectance measurements acquired in the red and near-infrared regions, respectively. These spectral reflectances are themselves ratios of the reflected over the incoming radiation in each spectral band individually, hence they take on values between 0.0 and 1.0. By design, the NDVI itself thus varies between -1.0 and +1.0.
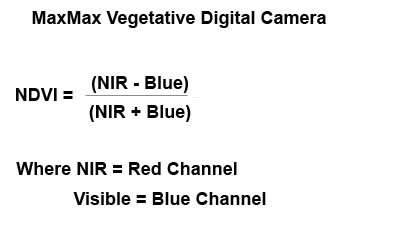
Please note that with the MaxMax vegetative camera, the formula changes because of the way our camera responds to the infrared and visible light bands.
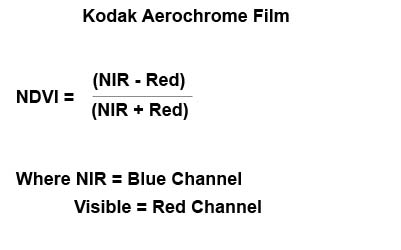
The blue channel for our NDVI can be used equally as well for the visible absorption channel as the Kodak film used the red as the visible absorption channel.
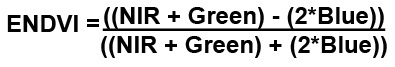
We have found that you can get even better results if you use the red and green as the reflective channels while using the blue as the absorption channel. Remember that a normal healthy plant will reflect both visible green light and NIR light. We can improve on the NDVI formula to an Enhanced NDVI (ENDVI) for these cameras by changing the formula:
Subsequent work has shown that the NDVI is directly related to the photosynthetic capacity and hence energy absorption of plant canopies.
Performance and limitations
It can be seen from its mathematical definition that the NDVI of an area containing a dense vegetation canopy will tend to positive values (say 0.3 to 0.8) while clouds and snow fields will be characterized by negative values of this index. Other targets on Earth visible from space include
- free standing water (e.g., oceans, seas, lakes and rivers) which have a rather low reflectance in both spectral bands (at least away from shores) and thus result in very low positive or even slightly negative NDVI values,
- soils which generally exhibit a near-infrared spectral reflectance somewhat larger than the red, and thus tend to also generate rather small positive NDVI values (say 0.1 to 0.2).
In addition to the simplicity of the algorithm and its capacity to broadly distinguish vegetated areas from other surface types, the NDVI also has the advantage of compressing the size of the data to be manipulated by a factor 2 (or more), since it replaces the two spectral bands by a single new field (eventually coded on 8 bits instead of the 10 or more bits of the original data).
Using the NDVI for quantitative assessments (as opposed to qualitative surveys as indicated above) raises a number of issues that may seriously limit the actual usefulness of this index if they are not properly addressed. Also, the NDVI has tended to be over-used (if not abused) in applications for which it was never designed. The following subsections review some of these issues.
- Mathematically, the sum and the difference of the two spectral channels contain the same information as the original data, but the difference alone (or the normalized difference) carries only part of the initial information. Whether the missing information is relevant or valuable is for the user to judge, but it is important to understand that an NDVI product carries only a fraction of the information available in the original spectral reflectance data.
- Users of NDVI have tended to estimate a large number of vegetation properties from the value of this index. Typical examples include the Leaf Area Index, biomass, chlorophyll concentration in leaves, plant productivity, fractional vegetation cover, accumulated rainfall, etc. Such relations are often derived by correlating space-derived NDVI values with ground-measured values of these variables. This approach raises further issues related to the spatial scale associated with the measurements, as satellite sensors always measure radiation quantities for areas substantially larger than those sampled by field instruments. Furthermore, it is of course illogical to claim that all these relations hold at once, because that would imply that all of these environmental properties would be directly and unequivocally related between themselves.
- The reflectance measurements should be relative to the same area and be acquired simultaneously. This may not be easy to achieve with instruments that acquire different spectral channels through different cameras or focal planes. Mis-registration of the spectral images may lead to substantial errors and unusable results.
Also, the calculation of the NDVI value turns out to be sensitive to a number of perturbing factors including
- Atmospheric effects: The actual composition of the atmosphere (in particular with respect to water vapor and aerosols) can significantly affect the measurements made in space. Hence, the latter may be misinterpreted if these effects are not properly taken into account (as is the case when the NDVI is calculated directly on the basis of raw measurements).
- Clouds: Deep (optically thick) clouds may be quite noticeable in satellite imagery and yield characteristic NDVI values that ease their screening. However, thin clouds (such as the ubiquitous cirrus), or small clouds with typical linear dimensions smaller than the diameter of the area actually sampled by the sensors, can significantly contaminate the measurements. Similarly, cloud shadows in areas that appear clear can affect NDVI values and lead to misinterpretations. These considerations are minimized by forming composite images from daily or near-daily images. Composite NDVI images have led to a large number of new vegetation applications where the NDVI or photosynthetic capacity varies over time.
- Soil effects: Soils tend to darken when wet, so that their reflectance is a direct function of water content. If the spectral response to moistening is not exactly the same in the two spectral bands, the NDVI of an area can appear to change as a result of soil moisture changes (precipitation or evaporation) and not because of vegetation changes.
- Anisotropic effects: All surfaces (whether natural or man-made) reflect light differently in different directions, and this form of anisotropy is generally spectrally dependent, even if the general tendency may be similar in these two spectral bands. As a result, the value of NDVI may depend on the particular anisotropy of the target and on the angular geometry of illumination and observation at the time of the measurements, and hence on the position of the target of interest within the swath of the instrument or the time of passage of the satellite over the site. This is particularly crucial in analyzing AVHRR data since the orbit of the NOAA platforms tended to drift in time. At the same time, the use of composite NDVI images minimizes these considerations and has led to global time series NDVI data sets spanning more than 25 years.
- Spectral effects: Since each sensor has its own characteristics and performances, in particular with respect to the position, width and shape of the spectral bands, a single formula like NDVI yields different results when applied to the measurements acquired by different instruments.
For these reasons, the NDVI should be used with great caution. In any quantitative application that necessitates a given level of accuracy, all the perturbing factors that could result in errors or uncertainties of that order of magnitude should be explicitly taken into account; this may require extensive processing based on ancillary data and other sources of information. More recent versions of NDVI datasets have attempted to account for these complicating factors through processing.
A number of derivatives and alternatives to NDVI have been proposed in the scientific literature to address these limitations, including the Perpendicular Vegetation Index, the Soil-Adjusted Vegetation Index, the Atmospherically Resistant Vegetation Index and the Global Environment Monitoring Index. Each of these attempted to include intrinsic correction(s) for one or more perturbing factors. It is not until the mid 1990's, however, that a new generation of algorithms were proposed to estimate directly the biogeophysical variables of interest (e.g., the Fraction of Absorbed Photosynthetically Active Radiation or FAPAR), taking advantage of the enhanced performance and characteristics of modern sensors (in particular their multispectral and multiangular capabilities) to take all the perturbing factors into account. In spite of many possible perturbing factors upon the NDVI, it remains a valuable quantitative vegetation monitoring tool when the photosynthetic capacity of the land surface needs to be studied at the appropriate spatial scale for various phenomena.
How these modified cameras work
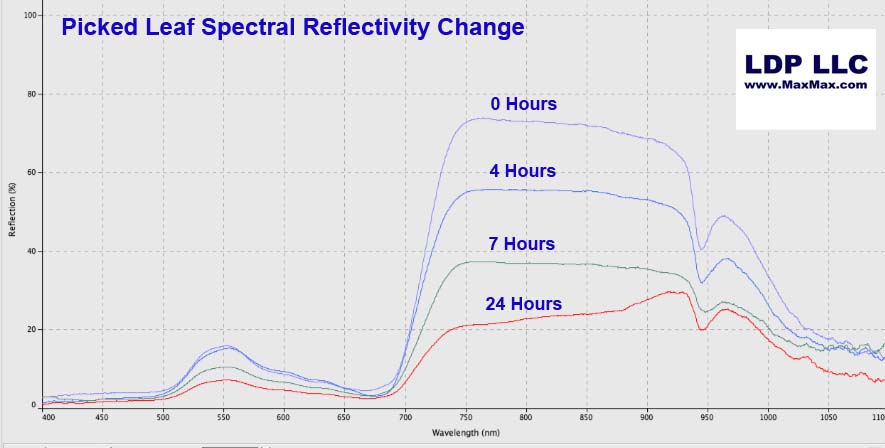
Notice how the reflectivity of the leaf changes especially in the near infrared region above 700nm.
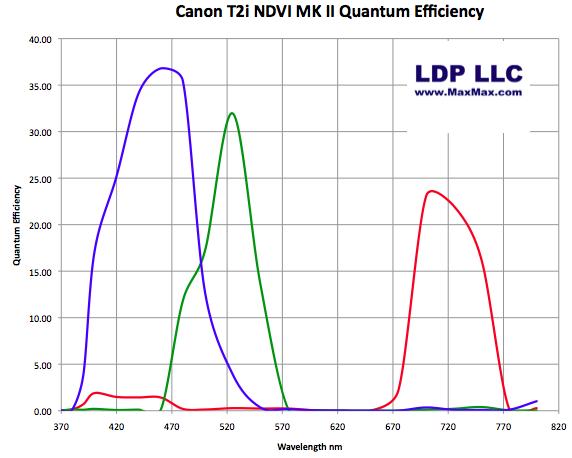
Quantum Efficiency is a way to measure how the camera responds to various frequencies of light. For the vegetation cameras, we have modified the camera so that it captures visible blue, visible green and near infrared light while not seeing visible red. Because the camera sees both infrared and visible light, we can calculate the various NDVI and ENDVI data.
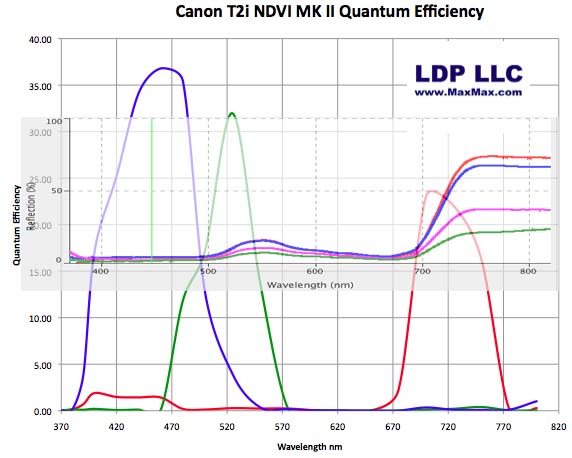
If we overlay the plant spectral response with the vegetation camera's spectral response, you can see how the various color channels record light from the leaf.