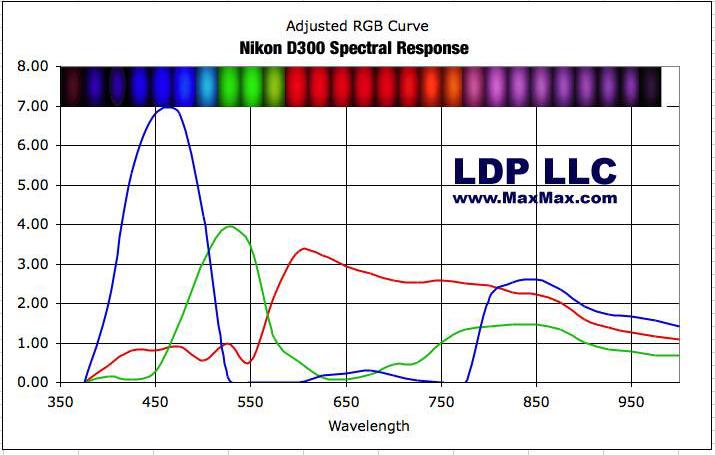
The overall Nikon D300 spectral sensitivity is shown below. The response curves show the response of a camera we have modified to see UV+Visible+Infrared light. The color dots at the top of the Adjust RBG Curves graph are actual pictures taken by a Nikon D300 at the corresponding wavelengths. This response curve is not the response of a stock, factory issued Nikon D300 which has a response limited to under 700nm.
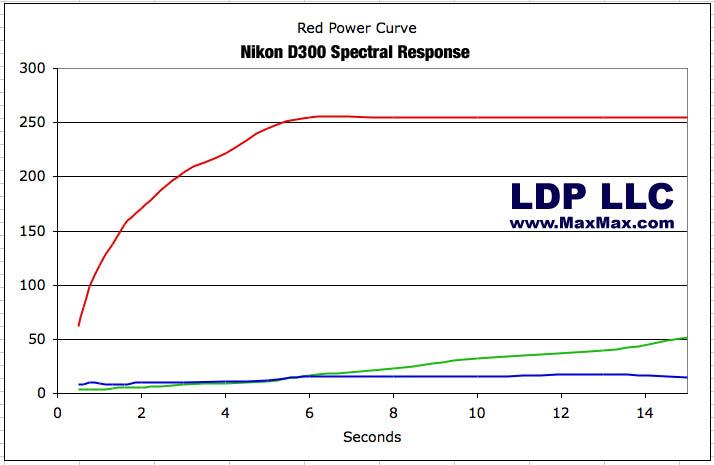
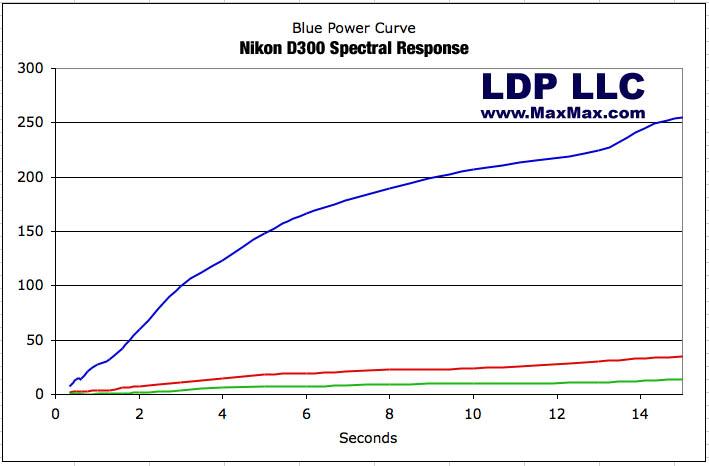
We measured the linearity of the sensor response the RGB peaks of 450nm, 550nm and 625nm. To measure linearity, we set the monochromator at the measurement frequency and varied the shutter speed from 1 to 30 seconds. The raw linearity graphs show that the sensor response is not completely linear. Note that the red response peaks at and clips at our set shutter speeds.
We do notice a few unusual characteristics about the D300.
| The sensor linearity is substantially curved. We would think that the sensor should behave in a linear fashion to the quantity of light. For instance, a 4 second exposure at 625nm should illuminate twice as much as a 2 second exposure at 425nm. In the red channel particularly, we notice that the response as a curve. | |
| At low light levels, noise in the green and red channel rises. As light increases, the noise is reduced. For instance, when testing the green 550nm power curve, at very low levels, the blue pixels illuminate more at 1/3 of a second than they do at 1 second. We are unsure of why this would occur. Perhaps Nikon is dithering low level signals to increase apparent resolution. | |
| Unusually, the blue channel is more open than the red channel after 775nm. Typically, the red channel is the most open in the infrared. | |
| There are some unusual red responses in the 475nm to 550nm region. |
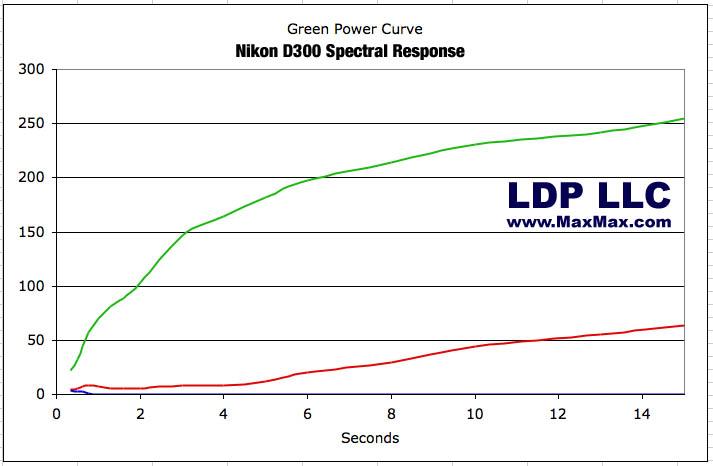
Note that after 6 seconds, the red channel is clipping. This is not a camera problem. Clipping occurs when the maximum value is reached. We show the response beyond red clipping so that you can see how the green and blue channels respond.