|
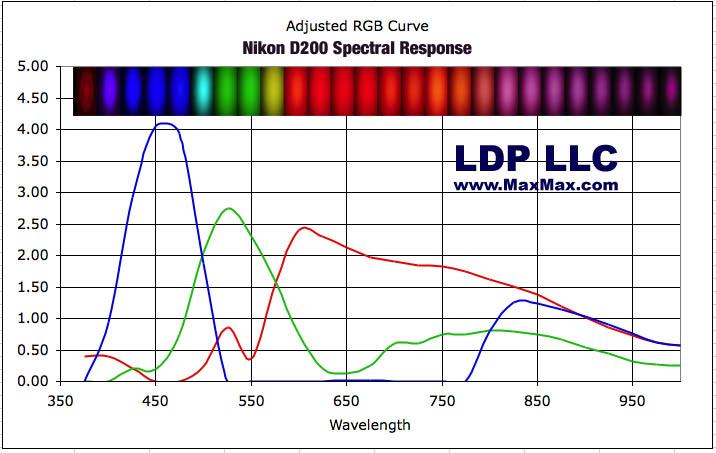
The overall Nikon D200 spectral sensitivity is shown below. The response curves show the response of a camera we have modified to see UV+Visible+Infrared light. The color dots at the top of the Adjust RBG Curves graph are actual pictures taken by a Nikon D200 at the corresponding wavelengths. This response curve is not the response of a stock, factory issued Nikon D200 which has a response limited to under 700nm.
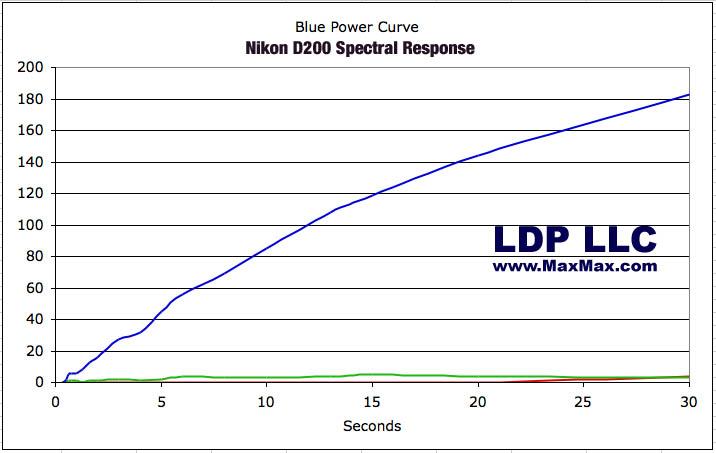
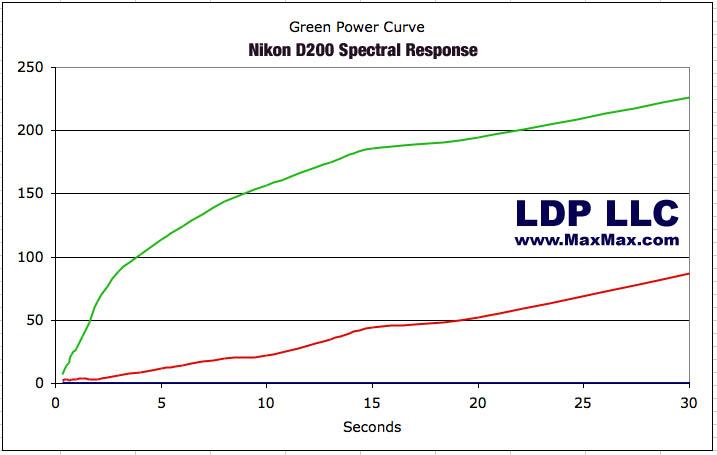
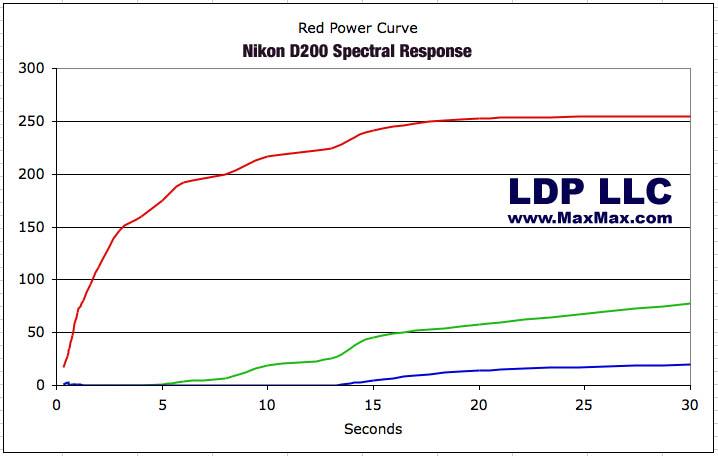
We measured the linearity of the sensor response the RGB peaks of 450nm, 550nm and 625nm. To measure linearity, we set the monochromator at the measurement frequency and varied the shutter speed from 1 to 30 seconds. The raw linearity graphs show that the sensor response is not completely linear. Note that the red response peaks at and clips at our set shutter speeds.
Note that after 15 seconds, the D200 red channel clips on this test. The maximum value for red is 255. This is not a camera problem.
|