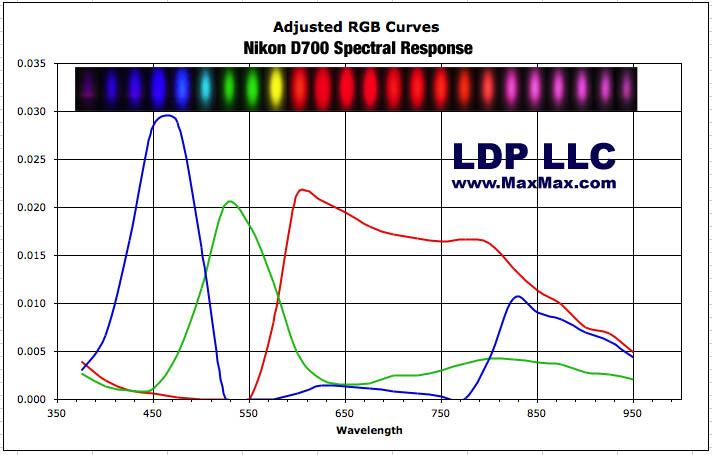
The overall Nikon D700 spectral sensitivity is shown below. The response curves show the response of a camera we have modified to see UV+Visible+Infrared light. The color dots at the top of the Adjust RBG Curves graph are actual pictures taken by a Nikon D700 at the corresponding wavelengths. This response curve is not the response of a stock, factory issued Nikon D700 which has a response limited to under 700nm.
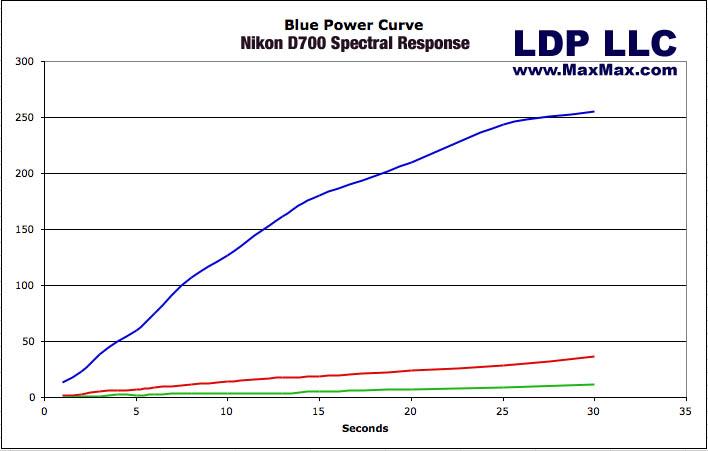
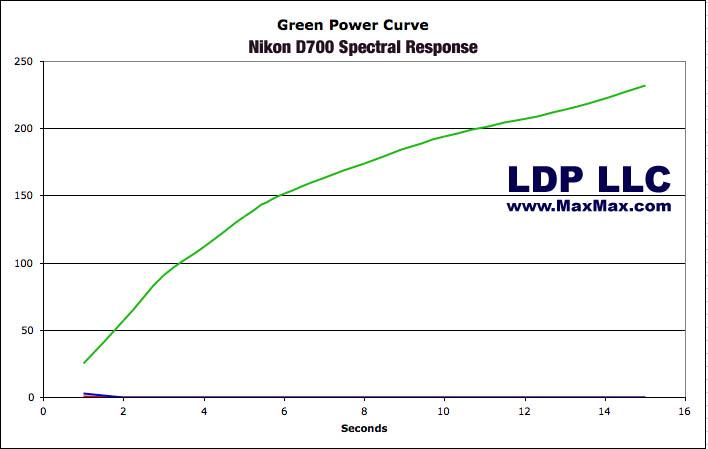
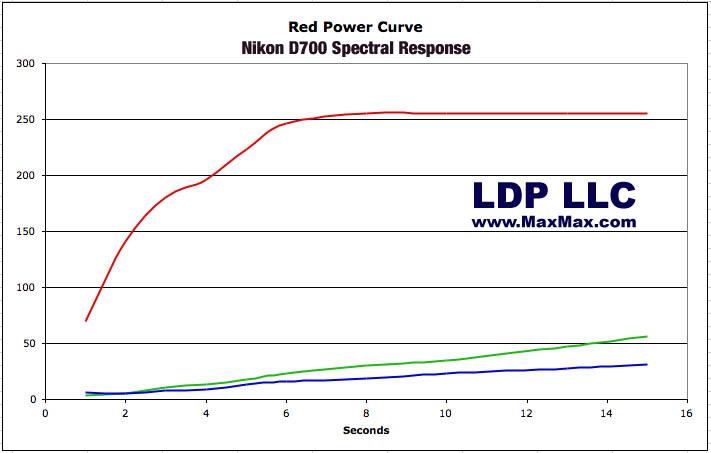
We measured the linearity of the sensor response the RGB peaks of 450nm, 550nm and 625nm. To measure linearity, we set the monochromator at the measurement frequency and varied the shutter speed from 1 to 30 seconds. The raw linearity graphs show that the sensor response is not completely linear. Note that the red response peaks at and clips at our set shutter speeds.
Small pictures of the raw RGB data.
400nm 6 Seconds

425nm 6 Seconds

450nm 6 Seconds

475nm 6 Seconds

500nm 6 Seconds

525nm 6 Seconds

550nm 6 Seconds

575nm 6 Seconds

600nm 6 Seconds

625nm 6 Seconds

650nm 6 Seconds

675nm 6 Seconds

700nm 6 Seconds

750nm 6 Seconds

775nm 6 Seconds

800nm 6 Seconds

825nm 6 Seconds

850nm 6 Seconds

875nm 6 Seconds

900nm 6 Seconds

925nm 6 Seconds

950nm 6 Seconds